
The Momentum's corner (#1)
Avoid investing against the crowd

The data and analysis presented here serve two purposes: to fine-tune the timing of Tactical Asset Allocation, and to cross-check crowd positioning against valuation and risk-reward metrics calculated independently.
1.1 What the CFTC data measures
The Commitment of Traders (COT) report, published weekly by the CFTC, breaks open interest in US futures markets into three groups of actors. For commodities, the two groups of analytical interest are Producers/Merchants (PM) — the commercial participants who use futures to hedge their physical exposure — and Managed Money (MM) — the hedge funds and CTAs whose primary motive is speculative profit. For financial contracts and currencies, the analogous groups are Asset Managers (AM) and Leveraged Money (LM).
In this report, each group’s weekly net long position (longs minus shorts) is converted into a rolling 3-year percentile rank (156-week window). A percentile of 100 means the group is more net long than at any point in the preceding three years. A percentile of 0 means the opposite extreme.
1.2 The core analytical logic
The fundamental insight is that the two groups have structurally different information sets and time horizons. Commercials are closest to the physical market and tend to be contrarian hedgers — they hedge most aggressively when they fear downside, and reduce hedging when constructive on their product. Speculative money tends to follow and amplify trends, arriving later but often pushing prices to extremes.
Three questions structure every asset analysis:
· Where is each group in its own 3-year range? (absolute level)
· Are they moving in the same or opposite direction? (convergence vs. divergence, columns “Composite” and “Spread” in the tables)
· Who is leading price — and who is confirming it? (lead/lag relationship)
SARIM’s team does not trade directly the signals associated with the data. One could, they have been backtested, and only the most relevant are listed in the table below. The team uses these data in order to better understand how the crowd is positioned and where it invests, in each asset but also from a cross-asset point of view. The principle is “NEVER INVEST AGAINST THE CROWD”
The team has selected the contracts with the most relevant signalling patterns.
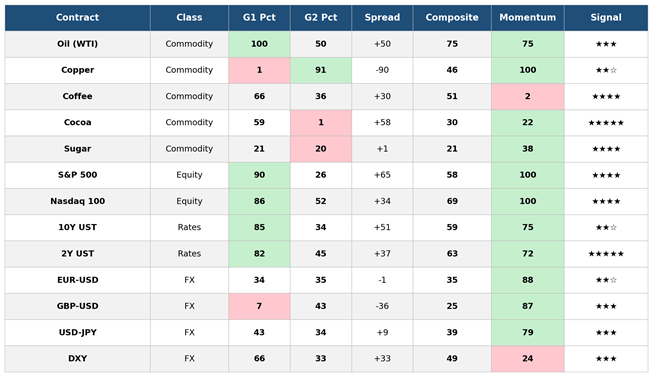
Green = pct ≥ 70 (elevated/extreme long) | Red = pct ≤ 20 (extreme short) | Momentum filter: green = above threshold, red = below. Momentum score = (Price − 52w Low) / (52w High − 52w Low) × 100.
This week at a glance — This week’s strongest gains were recorded for cocoa (+22.0%), the Nasdaq 100 (+4.5%), and copper (+4.4%, for which a buy signal is currently active). On the downside, the largest moves were seen in WTI crude oil (-6.2%), coffee (-3.7%), and sugar (-2.4%, for which a buy signal is currently active).
